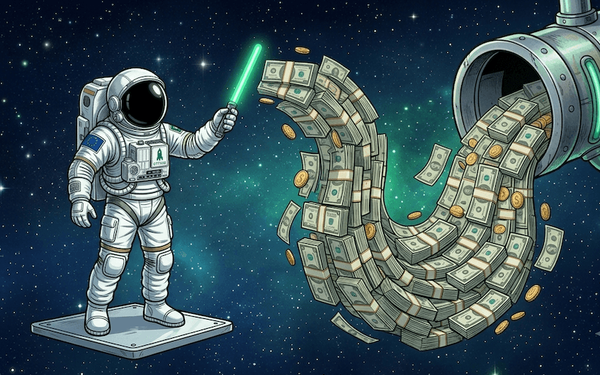
CAC Payback Period is the Metric Sales Leaders Need to Control
The era of cheap capital is over. Now the question is how long each customer takes to pay for themselves. CAC payback period is the metric that answers it, and sales velocity is the mechanism that moves it.


"The era of cheap capital and growth at all costs is firmly behind us."
That line is from our 2026 GTM trends piece. It is not a prediction. It is the operating environment your board is already pricing in.
Revenue growth used to be enough. More logos, more ARR, at any cost. Now, the question that follows a new customer is: how long until they pay for the cost of acquiring them?
How long until our new customers pay for the cost of acquiring them?
That is not a finance question. It is a sales question. And the metric at its centre is the CAC payback period.
Here is the formula, the benchmarks, and why sales velocity is the mechanism that moves it.
What Is CAC Payback Period?
CAC payback period is the number of months it takes to recover the cost of acquiring a customer. The formula:
If your revenue model is transactional rather than subscription-based, replace MRR with average monthly revenue per account. The formula still works; the number is just an estimate based on usage patterns, not a contracted commitment.
Customer Acquisition Cost (CAC) is the fully loaded number. The calculation: total sales and marketing spend in a given period, divided by new customers won in that same period. The hard part is deciding what goes in. For a sales-led team: AE salaries and variable comp, SDR costs, manager time allocated to deals, marketing programmes generating pipeline, CRM and sales tools, and RevOps headcount. Add event costs and travel if you run field sales. A useful test: would removing this cost reduce your ability to win new customers? If yes, it belongs in CAC.
Would removing this cost reduce your ability to win new customers? If yes, it belongs in CAC.
In a sales-led GTM motion, customer acquisition costs are usually structurally higher than in a product-led growth motion. Every rep, SDR, and sales manager belongs in it. That is the trade-off you are managing.
Payback isn't about revenue. It's about margin. A customer on a 50k€ ACV contract contributes 4 167€ per month in revenue. At 80% gross margin, they return 3 333€ toward CAC recovery. Not 4 167€.
Payback assumes the customer stays. It does not account for what happens if they leave before you recover your investment or shortly after. A 14-month payback to a customer who churns at month 15 means you barely broke even. One who churns at month 12 means you did not.
Acquiring new customers can be expensive. Joining GTM Club is free. Subscribe to our monthly newsletter to unlock sales-led growth.
Payback vs LTV:CAC
LTV:CAC, meaning Lifetime Value to Customer Acquisition Cost ratio, validates the long-term economics and tells you if you will ever earn on an acquired account. Payback tells you when you start earning on that account. You need both because a business can have attractive long-term economics and still run out of runway waiting for them to materialise.
A 3:1 LTV:CAC with a 30-month payback is a very different business than 3:1 with a 10-month payback. Below 1:1, you are losing money on every customer you win. The first needs constant outside capital to keep growing; the second funds itself. The last one won't work out.
According to Optifai's 2026 analysis of 939 B2B SaaS companies, the median payback period is 15 months. SMB-focused companies typically see 8–12 months. Mid-market looks at 14–18 months, and at the Enterprise-level it can extend to 18–24 months.
Measure CAC Payback Per Acquisition Channel
A mid-market SaaS company. ACV: 50k€. MRR: 4 167€. Gross margin: 80%. Monthly gross margin contribution: 3 333€.
Fully loaded CAC via outbound sales: 45k€.
CAC Payback: 45k€ ÷ 3 333€ = 13,5 months.
Same company, same product. The opportunity came via a referral partner. CAC drops to 28k€.
CAC Payback: 28k€ ÷ 3 333€ = 8,4 months.
Same revenue. Same gross margin. Over five months' difference in payback. From one acquisition channel to another.
When you blend them, the number looks acceptable. When you separate them, you find out which motion is actually earning its keep. The blended CAC trap: numbers look fine on average, while one channel quietly breaks your unit economics.
Sales Velocity Is the Lever
The sales velocity formula is:
Each of its four components maps directly onto CAC payback. Improve any one of them and payback improves. Sales velocity and CAC payback measure the same underlying problem from two different angles.
Every improvement to sales velocity is an improvement to payback.
Pipeline Quality and Win Rate
A pipeline full of poorly qualified opportunities is a CAC problem. Every hour an AE spends on an opportunity they will never win goes into the CAC of the ones they do close.
The same applies to the win rate. If your team closes 3 out of 10 opportunities, the full cost of the 7 that didn't close sits in the CAC of the 3 that did. Improve the win rate to 4 out of 10. Same team, same spend. That cost spreads across one more win. CAC falls by roughly 25%.
A pipeline of fluff and a low win rate are two versions of the same mistake: spending sales capacity on opportunities that will never convert.
Sales Cycle Length
Every extra month of the sales cycle is a month of AE, SDR, and manager cost invested before a single euro comes back. Reduce the sales cycle by 2 months by eliminating unnecessary delays, and CAC will fall. The payback formula improves on both inputs: lower CAC and the same monthly gross margin contribution starting sooner.
Average Deal Size
Every discount simultaneously shrinks the average deal size in the velocity formula and extends payback in the CAC formula.
A 20% discount on a 50k€ opportunity brings the contract value to 40k€. MRR drops to 3 333€, and at 80% gross margin, you'll earn 2 667€ per month.
Payback: 45k€ ÷ 2 667€ = 16,9 months.
Discounting just increased the payback on this deal from 13,5 to almost 17 months.
Expansion and Churn Impact CAC Payback
This article has treated the won accounts as stable with no changes to revenue after winning them. In reality, you can have customers downgrading and causing revenue churn. On the other hand, expanding accounts speed up the payback.
Net revenue retention is the one lever that operates after the deal closes. An account starting at 50k€ ACV and expanding to 70k€ by month 12 pays back faster on a cohort basis: the denominator grows, and effective payback compresses. This is worth noting, especially when building financial models for companies operating on a land-and-expand motion, expansion is what drives unit economics to compound over time for everyone.
Calculate Your CAC Payback Period
Pull your payback by acquisition channel, customer segment, and product. Not just blended. Make sure you know your customers' lifetime values, too.
Then look at your comparable sales velocity: Win rate, pipeline quality, cycle length, average deal size. Wherever velocity is dragging, payback is suffering.
Now you have your KPIs to work with. These metrics will point you to sales activities to invest in, areas to improve, and things to drop.